- ResiClub
- Posts
- Spring housing inventory with a price cut reaches a multi-year high
Spring housing inventory with a price cut reaches a multi-year high
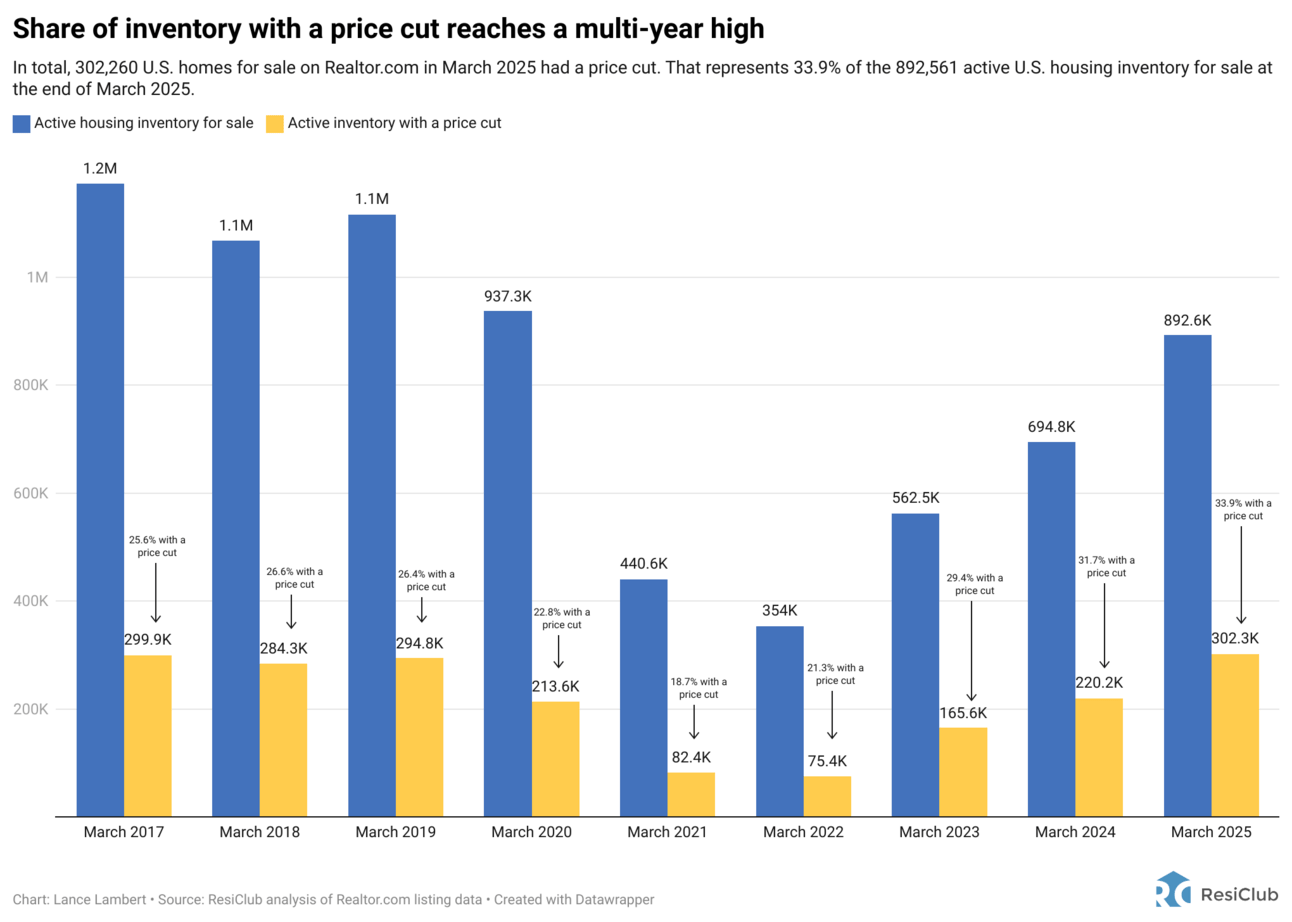
In total, 302,260 U.S. homes for sale on Realtor.com in March 2025 had a price cut. That represents 33.9% of the 892,561 active U.S. housing inventory for sale at the end of March 2025.
Lance Lambert
April 22, 2025
Today’s letter is brought to you by Epum!

ResiClub has a new data partnership with Epum, a real estate research lab which is focused on tracking commercial real estate projects—including single-family rental and built-to-rent—in planning or under construction nationwide.
Epum’s platform is the definitive resource for tracking, visualizing, and analyzing parcel-level site plan approvals, rezonings, and special exceptions for new housing or other CRE projects in planning.
All ResiClub readers are welcome to use the ResiClub discount code (ResiClub22025), to receive 10% off when subscribing to Epum.
You can watch Epum’s product demo here.
Just because a home listing gets a price cut doesn’t necessarily indicate that the home actually sold for less than its comps. Some agents use pricing strategies that intentionally list too high to test the market or create negotiation room. After all, even during the Pandemic Housing Boom—when home prices were surging—18.7% of U.S. homes for sale in March 2021 still saw a price cut.
That said, if the share of inventory receiving a price cut rises beyond typical seasonal patterns, it can suggest a market where homebuyers are gaining leverage. Conversely, if the share of inventory receiving a price cut falls beyond seasonality, it can indicate a market where home sellers are gaining leverage.
Percentage of U.S. active inventory receiving a price cut:
March 2017 -> 25.6%
March 2018 -> 26.6%
March 2019 -> 26.4%
March 2020 -> 22.8%
March 2021 -> 18.7%
March 2022 -> 21.3%
March 2023 -> 29.4%
March 2024 -> 31.7%
March 2025 -> 33.9%

How did ResiClub calculate this?
We divided the number of U.S. homes for sale that received a price reduction in March by the total number of active U.S. home listings during that same month.
The table below shows the raw data (the Realtor.com data series we used for this analysis only goes back to July 2016).
Big picture: This data is just one more bit of evidence showing that the national housing market’s supply-demand equilibrium has been shifting in homebuyers favor ever since mortgage rates spiked in late spring 2022 and the Pandemic Housing Boom fizzled out.
Of course, this all varies significantly across the country. Some markets—particularly in parts of the Midwest and Northeast—remain relatively tight, with sellers still in control. Others markets have just shifted into balanced markets, while some pockets of the Sun Belt have turned into outright buyer’s markets.
When it comes to nationally aggregated home prices, ResiClub tracks 5 major home price indices.
Unlike median or average sales and list prices, these indices help account for “mix shift.” According to these indices, national home prices are rising somewhere between +1.2% and +4.8% year-over-year.
Some of that variation is due to the fact that certain indices, like FHFA and Case-Shiller, are a little more lagged. Additionally, part of the variation stems from differences in the underlying methodology used to calculate each index.

ResiClub PRO members (paid tier) get the following:
3 additional subscriber-only housing research articles per week
Monthly ResiClub PRO Webinar
Access to Lance Lambert's housing trackers—includes metro and county level price and inventory analysis
Subscriber-only residential real estate research, rankings, and reports
PRO members may incorporate ResiClub branded charts into your personal marketing materials