Giant homebuilder PulteGroup pushes incentives to 9.9%—that’s $49,500 on a $500K sale
ResiClub PRO | Here are 7 things to know about PulteGroup’s latest earnings—a giant homebuilder ranked No. 229 on the Fortune 500.

What global policy shifts mean for institutional real estate, as told by Roofstock's Gary Beasley—here's the recording
On Thursday, January 29, we hosted special webinar with Roofstock executive chairman & co-founder Gary Beasley, looking at the institutional side of the housing sector.
Inventory Boomerang hits housing market as last year’s 10-year high in delistings turns into a relistings jump
Heading into this week, there were 76,426 relistings nationwide—up from 64,410 during the same week in 2025.
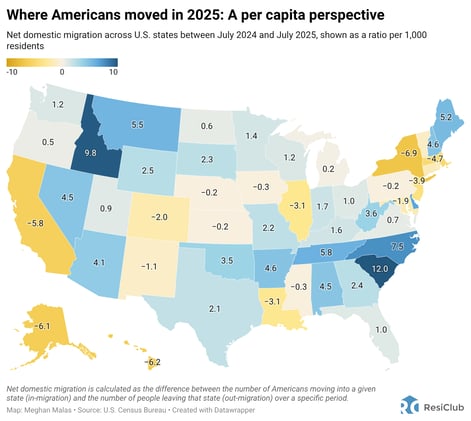
Net domestic migration: Which states are gaining—and losing—Americans
While Sun Belt states like Texas and Florida continue to see positive net migration, it’s far less domestic migration than during the Pandemic Housing Boom.
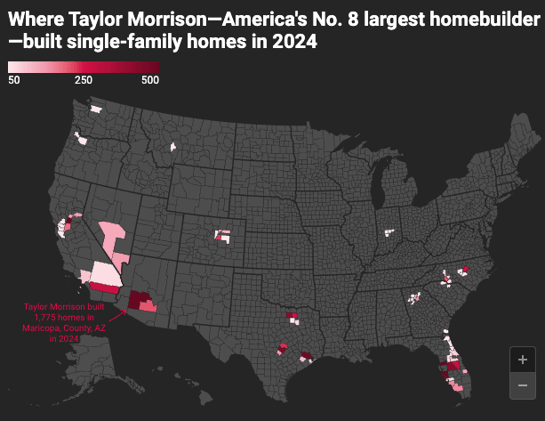
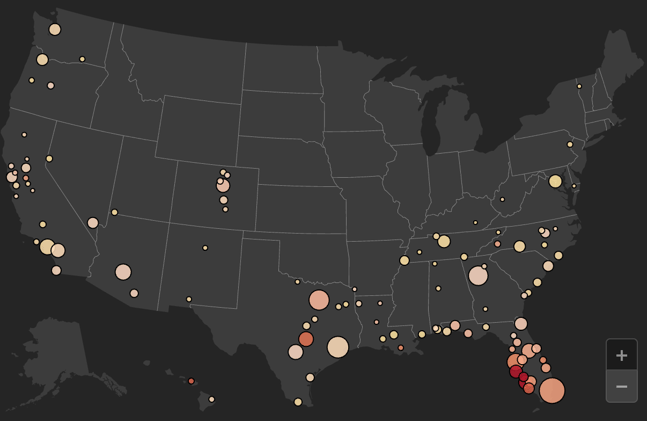
Housing footprints of America’s 21 largest homebuilders, shown with interactive maps
ResiClub PRO | Using the ResiClub Terminal, we pulled the county-level footprints of 21 of America’s largest homebuilders.
Archive



5 takeaways from D.R. Horton’s earnings: What America’s largest homebuilder is saying about housing
ResiClub PRO | D.R. Horton—a giant homebuilder ranked No. 123 on the Fortune 500 with a $46 billion market cap—has increased incentive spending, helping give buyers some monthly payment relief.


Build-to-rent is exempt from White House’s order to 'ban' institutional homebuying
Rental housing economist Jay Parsons: “The order doesn't actually ban institutional buyers (presumably due to legal limits) but [it] does look to limit it through various means like blocking Fannie and Freddie loans."


